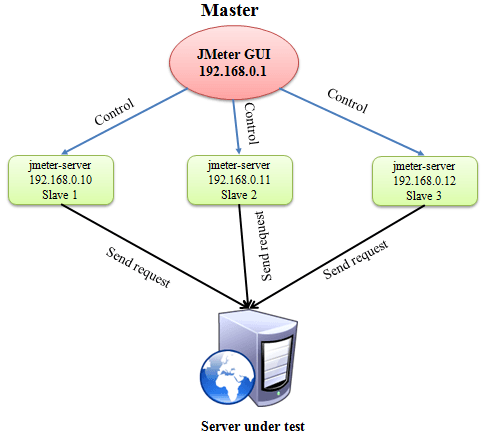
Distributed load testing in JMeter is the process of simulating large number of virtual users using multiples systems or load generators. One single machine may not be able to generate the desired virtual users for a load test due to its hardware capacity limitations and hence JMeter allow us to connect multiple machines to achieve the goal. In JMeter, this is achieved by creating a Master-Slave configuration. For Example, You want to run a load test with 1000 virtual users but what if your machine is unable to generate more than 500 virtual users ? To overcome this issue, you can use the distributed testing in JMeter. Master: T he system running Jmeter GUI, which controls the test. Slave: the system running jmeter-server, which takes commands from the GUI and send requests to the target system(s). In other words, it’s the load generator machine which create the threads and send request to target system to simulate the user l...
Comments
Post a Comment